 We’re back with part two of our Google Analytics series. If you missed part one, be sure to check it out right here. In part one, we took a look at the basics and gave you a general overview to reading and understanding Google Analytics. Today we are going to dive into Google Analytics a little deeper and break down each section bit by bit so that you’ll have the confidence and know-how to start using your data to grow and improve your blog.
Audience
The audience report provides valuable insights that help you understand your audience better. With a better understanding of your audience, you’ll be able to produce more content your readers will love, which will keep them happy and thirsting for more. Here’s a breakdown of what each section of data in the audience report tells you.
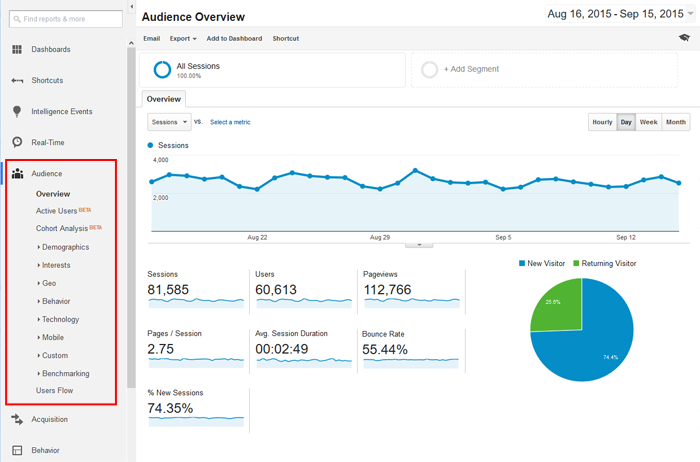
ACTIVE USERS – Shows you how many active users you have in increments of 1, 7, 14, and 30 days. This info can be used to determine the level of long-term engagement your readers are having with your site and content. Do your readers visit once and never return or are you producing content that motivates repeat visits by your readers week after week? This metric helps in determining how well your content motivates visitors to come back for more.
COHORT ANALYSIS – A cohort is a group of readers that share a common characteristic. For example one of your cohorts might include traffic generated by a single day email campaign or promotion. With the cohort analysis you can watch how traffic generated each day performs over time. Does the traffic acquired on a certain day seem to disengage with your content after a certain number of days? This information can help you in understanding how frequently you need to post on your blog, send out email campaigns, etc. in order to consistently keep your traffic engaged with your content.
DEMOGRAPHICS – Shows the age and gender of your readers. This information can help you tailor your content and advertising campaigns to the primary age group and gender of your readers.
INTERESTS – Provides information about the interests of your readers and is based on your readers online purchasing activities, travels, and online searches. This information can help you better cater your posts to the interests of your readers.
GEO – Shows you the main locations and languages spoken by your readers.
BEHAVIOR – Shows whether the traffic during a designated time frame consists of new visitors vs. returning visitors. Is your site attracting a high percentage of new visitors? If not, what changes can you make to gravitate new readers to your site?
TECHNOLOGY – Shows the browsers most widely used by your readers. It’s important to make sure your design is translating well across all of the main browsers being used to view your site. This metric also shows the networks (Verizon, Comcast, Qwest, etc) most used by your readers.
MOBILE – Shows the type of devices (desktop, mobile, tablet) being used by your readers. Not having a mobile responsive site could prove detrimental if the majority of your readers are using a mobile device. It also shows the brands of devices being used by your readers (iPhone, Google Nexus 5, Samsung Galaxy, etc.).
CUSTOM (must be configured) – Allows you to set and define custom variables.
BENCHMARKING – Compares your site data against other sites in your industry that have opted to share their data. This can be helpful in knowing how you are doing compared to your competition.
USERS FLOW – This is a cool graphic that shows you the paths your readers take through your site. Where they are entering and where they are exiting.
ACQUISITION
This section of your analytics shows how people are finding your site. When you know where your readers are coming from, you’ll have a better idea where to spend your efforts so you can drive even more traffic to your site through those primary sources.

ALL TRAFFIC – Shows your top traffic sources including social networks and websites people are being referred from. If people are coming from a website, you can click on the domain to see the specific posts that are sending traffic your way. This can be a great tool for developing relationships with the bloggers linking people to your site and/or for evaluating whether or not your networking efforts are paying off.
ADWORDS (must be enabled) – If you have Google Adwords enabled, you can view the performance stats of your adwords here.
SEARCH ENGINE OPTIMIZATION – Shows all of the keywords people have entered into search engines to find your site. It also shows where your site ranks in search engines for each keyword and the landing pages those keywords take people to. This information can be helpful as you work on bettering your SEO.
SOCIAL – Shows the top social networks driving traffic to your site. Here’s a breakdown of the data you might find helpful:
- Network Referrals: Click on each social network listed to see which posts/pages on your site they are sending traffic to and how long people are staying.
- Data Hub Activity: Reports activity from Google partner networks like Google+, Disqus, etc.
- Landing Pages: Shows which pages on your site receive the most traffic from social networks.
- Trackbacks: Shows blog posts made by others that have linked people to your site.
BEHAVIOR
The behavior report helps you understand how visitors are moving through your website and how well they are engaging with your content.
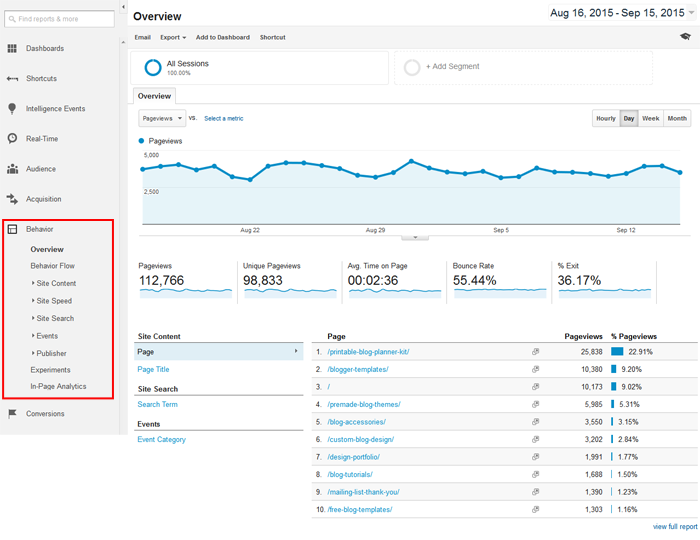
BEHAVIOR FLOW – Another flow chart that shows the path visitors take when landing on your site. Shows the first pages they land on through the final pages they exit from.
SITE CONTENT – Shows the top posts or pages on your site that attract the most traffic. Also shows the average time spent on those pages. This information can help you determine what content performs best on your site.
SITE SPEED – This breaks down the average load time for each page on your site. This information is helpful in knowing which pages might be causing your site to load poorly. If a page is slow loading, try reducing the sizing of the images on the page or removing unnecessary clutter.
SITE SEARCH (must be activated) – This shows data about the search terms people enter into the search box on your website.
EVENTS (requires set up) – Allows you to track specific actions on your website such as file downloads, video plays, clicks on external links, etc. Once it’s set up, you’ll be able to view these reports.
PUBLISHER (must be activated) – If you use Google Adsense, this is a great feature to activate because it shows the revenue you’ve earned from Google Adsense as well as the top pages on your website that help generate the most Adsense revenue for you.
RELATED: 10 Things To Do Before Adding Google Adsense
EXPERIMENTS (requires set up)- This can be set up to test how different landing page configurations work to help you reach your goals. This report can help you tweak your landing page until you find the configuration that results in the highest conversion rates.
IN-PAGE ANALYTICS (must be activated) – This is a cool feature that allows you to view a live view of your web pages along with your Google analytics data. It shows percentages next to each link on the page so you know which links are receiving the most attention on your site.


Erin, Thanks for breaking down the Google Analytics mystery. This helps a ton!
Wow, Thank you very much. This helps a lot. I finally understand all the functions of Analytics.