Now that you have Google Analytics installed to your site (see instructions here for Blogger or here for WordPress), let’s take a look at how to read your data. Today we’ll be discussing the main reports you can use to determine how the content on your site is performing. These reports and the additional reports we’ll be discussing in the upcoming weeks can help you determine the best ways to improve and grow your blog.
Audience Overview
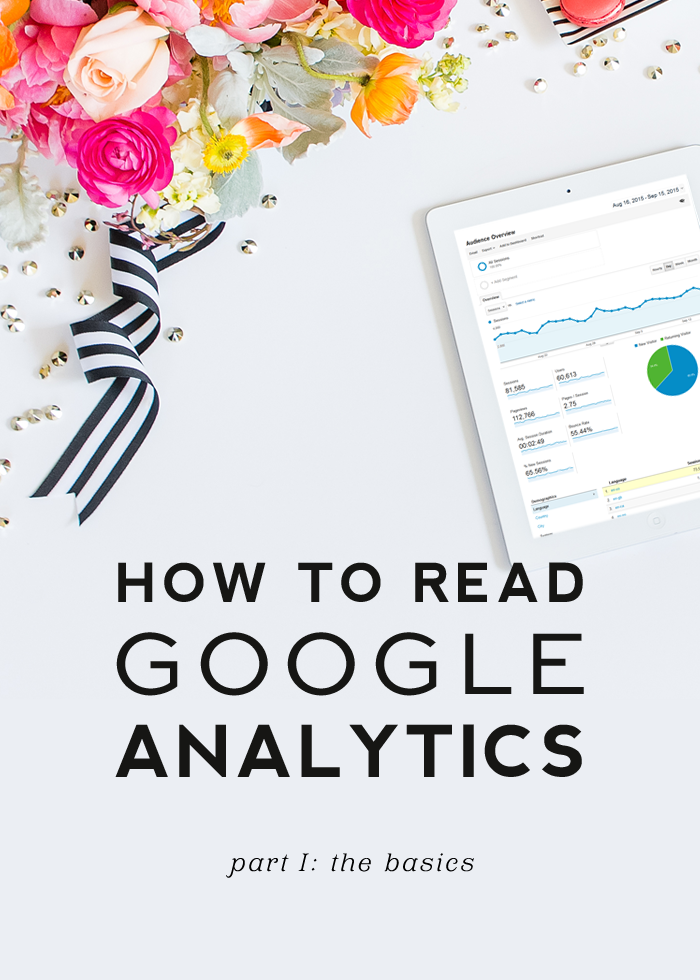
When you first open your Google Analytics account, you will land on your Audience Overview. This report gives you a general overview of what is happening on your site. You can set the date range you want to view and select if you want to view the data by hour, day, week, or month. I personally like to view the data by day so I can see which blog posts, newsletters, or social media posts in the designated date range have helped to draw in the most traffic. You can also use this chart to determine your slower traffic days.
Here’s a break down of what each section of data tells you:
SESSIONS – Shows you the total number of times your site has been viewed in the designated time period. This number includes repeat visitors, so if the same visitor viewed your site 5 times in the designated time period, each of those 5 times would count as a separate session.
USERS – Shows the total number of individuals that visited your site during the specified time period. This number does not include any repeat visits by an individual.
PAGEVIEWS – Shows the total number of pages viewed on your site in the designated time period.
PAGES/SESSION – Shows the average number of pages visited per session during the specified time period.
AVG. SESSION DURATION – Shows the average time (in minutes) visitors stayed on your site during their visit.
BOUNCE RATE – Shows the percentage of visitors that landed on an individual page on your site and then left without navigating to a second page. The goal is to have a low bounce rate. The more you can get visitors to click around on your site, the lower your bounce rate will be.
% NEW SESSIONS – Shows the percentage of visits to your site by visitors who have never visited your site before. The pie chart also shows the percentage of new vs. returning visitors to your site.
Our Ultimate Blog Planner Kit provides a page for tracking the data from the Audience Overview to help you in your efforts to improve and grow your blog. Click here for the free download.
Real-Time Overview
This is fun data to look at because it shows how many people are on your site at any given time. It also details what posts or pages people are currently looking at and where those visitors are located. This data can be helpful in analyzing traffic immediately after you post on social media or send out a newsletter to see what type of spike occurs in real-time visitors.
Acquisition Overview
The Acquisition Overview details where your site traffic is coming from and will generally show you the top 4-6 channels: Organic Search, Direct, Social, Referral, Email, and Other.
ORGANIC SEARCH – Shows how many people are discovering your site through search engines.
DIRECT – Shows how many people simply type your url into their browser or use a bookmark to visit your site.
SOCIAL – Shows the number of people who come to your site via social media (Facebook, Twitter, Pinterest, Instagram, etc).
REFERRAL – Shows the number of people finding you through a referring site. Maybe you were mentioned in a post on another blog, for example.
EMAIL – Shows how many people click over to your site from an email or newsletter you’ve sent out.
Behavior Overview
The Behavior Overview is similar to the Audience Overview except that it focuses on pageviews. It’s great because it lists the links to the top pages and posts on your site. This information can be useful in knowing the types of content or products your visitors enjoy most so you can provide your visitors more of what they love.
In the coming weeks we’ll be breaking down each of these sections further and showing you how to use the information in each section to pinpoint exactly where your readers are coming from, how your readers are engaging with your content, which keywords and phrases cause your website to appear in search engines, which social media platforms are driving the most traffic, etc. Learning how to use and interpret Google Analytics will be a key resource to growing your blog, so stay tuned!


Great post, thanks for explaining it all! Wendy from Front Porch Mercantile
Thanks for such a great summary. Fantastic
Wow, thanks! I’m staying tuned!
Thank you! This is really useful information explained in a simple way; I’ll be tunning in for more.
Thanks for the post – really helpful to newbies like moi! Keeping ’em peeled for the next installment!
I love it! This is why I follow DB religiously. And because of the photos. 😀 😉
Hi – I can’t seem to find the Yoast version in WordPress. Is the version you are demonstrating on still available in June 2016? I’m really keen to get this going on my new website.
You can find the Yoast plugin here: https://wordpress.org/plugins/wordpress-seo/. Hope this helps!
This is a great post. I learned a few new things. thank you!
Thanks for the break-down! Trying to navigate these stats can be confusing.
Thank you for putting all this in plain English. As a new blogger, there is so much to learn so it’s nice when someone makes is simple.
This is a wonderful post. I’ve been blogging for about a year but analytics was a bit scary to me. I know I need to be tracking these! I have a small Google Analytics box at the bottom of my Dashboard home page and it doesn’t offer many of these analytics you mention here. Should I be using a different plug in? Thanks!
You need to log into your main Google Analytics account to view all of the info shown in this post. What you see through your WordPress dashboard will be very limited in comparison. Hope this helps!
Can you do and updated version of this. I feel like a lot has changed and I’m trying to get around but I don’t seem to recognize some of the areas you’re talking about like the audience overview … I’m not sure thats what I am looking at when I first log in.
Actually per my previous comment about updating this post.
The reason I was not seeing what you have is because I had to install a “dashboard” first. It did not come installed for me so I didn’t the Audience Overview I just saw my settings. I chose the start up one they offer and I also installed another one from the gallery.
Maybe include that you have to install a dashboard before you can actually see the Audience Overview…
Hope this helps, if this is not the same for everyone just ignore. Lol.
I just installed Google Analytics on my site and couldn’t make heads or tails of what any of it meant until reading this post. Thank you so much for sharing!
I noticed that a lot of times the analytics of a particular platform includes your own personal visit as well (you know, when you visit to see how it looks on the “outside”) is there a way to avoid this? I use Square Space and I often find this frustrating.
Thanks in advance.
Yes, there is a way to avoid this. This will show you how: https://support.google.com/analytics/answer/1034840?hl=en Hope this helps!
Wow, very informational